Reporting Web 3D Capabilities on a Budget of $3 a Month
The architecture behind Web3DSurvey, two Cloud Run services, a partitioned BigQuery store, and a transparent JSON cache that let me report real-world WebGL and WebGPU support for a few dollars a month.
Ben Houston • • 11 min read
I run Web3DSurvey.com as a community service. It collects real-world WebGL, WebGL 2, and WebGPU capability data so 3D web developers can pick features from measured support rates instead of guessing. I have written about why I built it and what the v2 rewrite added. This post is about a different question people keep asking me: what does it cost to run, and how does the pipeline hold up?
In April 2026 the services that serve the site and store the data cost about C$3. During June 2026 the collector received roughly half a million requests. Each request carried one sample with up to 596 data points, for close to 300 million data points a month.
I started this project in early 2023 to learn React and BigQuery, neither of which I had used in production. The learning stuck, and so did the low bill. The architecture separates collection, reporting, and the costs of running both.
Collector#
What the collector measures#
The collector is a small script that a 3D site embeds through an iframe. After probing the browser for WebGL, WebGL 2, WebGPU, WebXR, and device capabilities, it submits the resulting stats object to the api server. The dedicated api-server drops bot traffic, adds normalized platform, browser, and engine fields, then inserts samples into BigQuery in batches of ten (which cuts down on the BigQuery bills).
I initially used the legacy streaming insert API but I replaced it with the BigQuery Storage Write API. The current volume fits inside its monthly free ingestion allowance, so this reduced significantly my BigQuery costs.
Reducing client impact#
The collector is meant to be polite to host pages. Participating sites embed it as a tiny iframe rather than running the collector script directly in their own page. This achieves two separate things: security -- it prevents the collector script from accessing anything in the host page, and performance -- it avoid the collector script from slowing down the host page:
<iframe
  title="Web3D Survey"
  src="https://web3dsurvey.com/collector-iframe.html"
  style="width: 1px; height: 1px;"
></iframe>
Why the collector reports with GET first#
The collector tries to report the sample with a GET request before falling back to POST. That sounds odd for analytics data, but it cuts the number of cross-origin requests to my server in half. A JSON POST from the embedded collector triggers a CORS OPTIONS preflight request and then the actual POST. A plain GET with the compressed payload in the query string does not need that preflight, so successful reports reach the server in one request instead of two.
The payload is still the same stats object. The collector stringifies it, gzip-compresses it, base64-encodes the compressed bytes, and stores the result in the stats query parameter:
const statsAsBytes = new TextEncoder().encode(JSON.stringify(stats));
const compressedStats = gzipSync(statsAsBytes, { level: 9 });
const encodedStats = btoa(String.fromCharCode(...compressedStats));
const searchParams = new URLSearchParams();
searchParams.append('stats', encodedStats);
await fetch(`${collectionUrl}?${searchParams.toString()}`);
I am not doing this to sneak around analytics blockers. Those usually block by domain or path, not by whether a request is a GET or a POST.
Half a million samples in BigQuery#
Web3DSurvey receives about 500,000 collector requests each month. Each request carries one sample with up to 596 data points. That works out to about 300 million possible data points a month. Some fields are empty when a browser does not support an API, but the shape is wide enough that I want a database built for analytical scans.
I have tried storing analytics data in PostgreSQL before. PostgreSQL is excellent for application transactions, but wide on-demand analysis over a growing event table becomes expensive and difficult to keep responsive. I would end up building summary tables, background aggregation jobs, or a second analytics system around it.
BigQuery gives me that analytical system directly. The samples go into five day-partitioned tables for browser, WebGL, WebGL 2, WebGPU, and WebXR data. Each partition expires automatically after 120 days:
bq mk --table \
  --time_partitioning_field createdAt \
  --time_partitioning_type DAY \
  --time_partitioning_expiration 10368000 \
  --schema ./webgl2.json \
  web3dsurvey:stats_v4.webgl2
The retained tables currently occupy about 6.2 GiB in Google's us-central1 region in Council Bluffs, Iowa. BigQuery includes the first 10 GiB of logical storage each month, so storing this dataset currently costs C
0.14 a month.
The paid work is inserting data and pulling it back out for analysis. This project uses legacy streaming inserts, which charge for successfully inserted rows. On-demand queries charge by bytes scanned after a large monthly free allowance. The reports only query the last 7 days, so they scan a narrow slice of the retained data.
Reporting#
The collector and reporting paths run independently. The api-server writes samples, while the web3dsurvey service reads aggregates for the public site. A traffic spike on one side cannot starve the other.
Small queries and JavaScript rollups#
The reporting service does not run one giant aggregation query. It runs many small ones and assembles the summaries in JavaScript.
A single feature query pulls the raw true/false counts grouped by platform and browser, filtered to the 7-day window:
SELECT
  platform.name AS platformName,
  browser.name AS browserName,
  COUNTIF(extensions.`EXT_color_buffer_float` = TRUE) AS `true`,
  COUNTIF(extensions.`EXT_color_buffer_float` = FALSE) AS `false`,
FROM `web3dsurvey.stats_v4.webgl`
WHERE platform.name IS NOT NULL
  AND version >= 7
  AND DATE(createdAt) >= DATE_SUB(CURRENT_DATE(), INTERVAL 7 DAY)
GROUP BY platformName, browserName
Then JavaScript turns those counts into the support fractions, per-platform breakdowns, and per-browser-family rollups the page displays. The same pattern handles cumulative limit distributions, adapter and vendor hierarchies, and top-N trimming. Keeping the aggregation in JavaScript keeps the SQL simple and the logic in one language I can test.
The cost is fan-out. A full WebGL report runs one of these queries per extension and per parameter, plus adapter and support queries, all in parallel:
const [featuresArray, limitsArray, rendererInfo /* ... */] = await Promise.all([
  Promise.all(extensionNames.map((name) => getFeatureStats(tableName, 'extensions', name))),
  Promise.all(parameterNames.map((name) => getLimitStats(tableName, 'parameters', name))),
  getGraphicsAdapterStats(tableName, 'rendererInfo', 'renderer'),
  // ...
]);
Each query takes around 500 ms against BigQuery. A single report needs dozens of them. If I ran them fresh for every page view the page would take several seconds to build.
A transparent JSON cache#
I could not rely on BigQuery's built-in result cache. BigQuery skips the cache when a referenced table has recent streaming inserts, even if the query filters for older partitions whose data has not changed. With samples arriving throughout the day, I needed a cache outside BigQuery whose lifetime I could control.
I wrote a generic caching layer that sits in front of BigQuery. Every aggregation call goes through one cache() function that takes a name, the query parameters, a TTL, and a creator function that does the real work:
const rows = await cache<GetFeatureStatsQueryResult>(
  'getFeatureStats',
  { tableName, categoryName, featureName, minVersion },
  cacheExpiration,
  async () => bigQuery<GetFeatureStatsQueryResult>(query, getFeatureStatsQueryResult),
  getFeatureStatsQueryResult,
);
The cache checks memory first, then a JSON file in Cloud Storage, and only calls the creator on a miss. The key is a hash of the parameters, so each unique query gets its own cached file. The TTL is 2 days.
When a cached file exists but has expired, the layer serves the stale copy immediately and revalidates in the background, so a visitor never waits on a cold query:
if (isExpired) {
  void creator().then((newData) => {
    this.memoryCache[cacheKey] = { timeStamp: Date.now(), data: newData };
    file.save(JSON.stringify(newData), { contentType: 'application/json' });
    return newData;
  });
}
Because the underlying data only shifts by one day out of a 7-day window, a 2-day-old aggregate is accurate enough to serve. The one manual step is a cacheVersion constant I bump whenever the shape of an aggregated result changes, which invalidates every stale file so the site cannot keep serving an old layout.
Why the website does not wait for the data#
The site has changed frameworks more than once. I started on Next.js in early 2023 because it had the most momentum, moved to Remix, and now run on TanStack Start with Router and Query. Each move was about fitting the way I wanted to render this specific site.
The current model renders in two stages. TanStack Start server-renders the page shell and the surrounding markdown so the page appears immediately. The stats themselves load client-side through TanStack Query, filling skeleton placeholders as each report arrives. The React Compiler handles memoization of the component tree.
I did try prefetching stats in the route loader so the server render would include the numbers. I removed it. On a cache miss, that approach turns a fast shell render into a multi-second wait while the server handles the query fan-out. Rendering the shell first and loading the data afterward makes the page useful in well under a second, with the numbers arriving a beat later.
Costs#
The bill#
The April 2026 breakdown for the running service, in Canadian dollars:
| Service | April 2026 cost |
|---|---|
| Cloud Run | C$2.30 |
| Cloud DNS | C$0.55 |
| BigQuery | C$0.18 |
| Cloud Storage | C$0.01 |
| Total | ~C$3.04 |
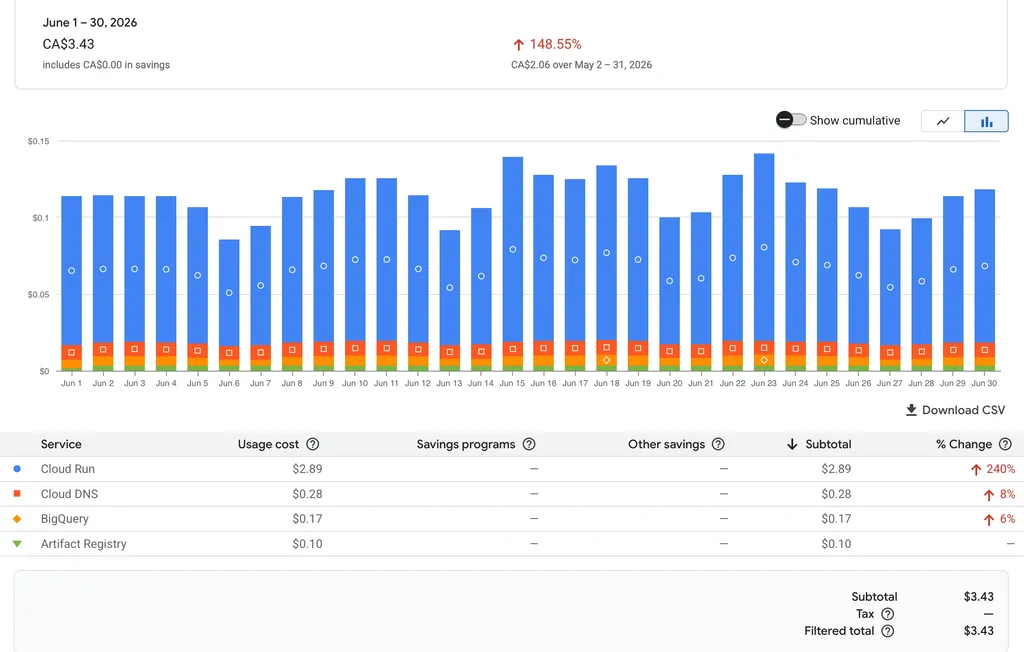
The two services, query processing, cache storage, and DNS together cost about C
0.18 came primarily from legacy streaming inserts; the retained data itself fit inside the free storage allowance.
Here is the June 2026 billing screenshot straight from Google Cloud without discounts turned off, it was still only $3.45 Canadian:
What the cache saves#
Without the cache, every report page view could launch dozens of BigQuery queries. With a two-day TTL, each active cache key usually refreshes about once every two days:
30 days / 2-day cache lifetime = about 15 refreshes per month
That changes the workload from queries per visitor to roughly 15 refreshes per active aggregate each month. A report that gets one view and a report that gets thousands of views place almost the same load on BigQuery. It also keeps 500 ms query latency away from the page-rendering path.
Cloud Run#
The project runs as two Cloud Run services. Both request 1 vCPU and 256 MiB and handle up to 80 concurrent requests per instance.
Neither service reserves a minimum instance, so both can scale to zero. Steady traffic tends to keep the api-service warm, but I only pay for the time they use. Cloud Run cost C
5.97 of usage discounts came off about C$8.25 of list price.
Container images add up#
Every push to main or prod builds a Docker image for each service and stores it in Artifact Registry. When making changes I deploy often, and without a cleanup rule those images never leave. I like to keep at least a few recent buids in case I somehow break the service and need an emergency rollback. My current clenaup policy is this: keep the three most recent versions and deletes anything older than three days:
resource "google_artifact_registry_repository" "general_repository" {
  # ...
  cleanup_policy_dry_run = false

  cleanup_policies {
    id     = "keep-most-recent-2"
    action = "KEEP"
    most_recent_versions {
      keep_count = 2
    }
  }

  cleanup_policies {
    id     = "delete-older-than-3-days"
    action = "DELETE"
    condition {
      tag_state  = "ANY"
      older_than = "259200s"
    }
  }
}
The KEEP rule wins over the DELETE rule, so the three newest images survive even once they pass the three-day mark.
What I would change#
BigQuery does not have the type-safe schema and migration workflow I get from Drizzle Kit on newer projects such as SelfLoop and Land of Assets. Web3DSurvey defines its tables with hand-written JSON schemas and a shell script. Adding a field means changing the schema and TypeScript separately and trusting that they still agree. I would like to replace that with a typed schema layer and modern migrations, but there doesn't seem to be any robust tooling for this and I don't want to write it myself.
The manual cacheVersion is another rough edge. It works, but forgetting to bump it after changing an aggregate can leave old JSON results in place for two days. Deriving the version from the result schema would make invalidation harder to miss.
None of those changes the basic design. The low bill comes from using CloudRun, separating append-only collection from heavily cached reporting, expiring old partitions, and querying only the last week.
What the budget buys#
For a few dollars a month, any 3D web developer gets measured support rates for WebGL, WebGL 2, and WebGPU features, adapter and vendor breakdowns, browser capability stats, and a live /machine report to compare the device in front of them against the population.
If you run a 3D web app and want to contribute, the collector is a one-line iframe!